
How to Calculate Expected Points (xPts)

As football analytics has grown, it’s also transformed how we evaluate team performances, moving beyond traditional metrics like goals scored or matches won.
In this article, we’ll dive into how to calculate expected points (xPts), how to use it for post match analysis, and how to implement it via Python.
I was first intrigued by expected outcomes and probabilites for evaluating and predicting matches when I came across this article from 538.
While xPts isn’t the exact same model as they used, it is still a good way to estimate the points a team should earn based on the quality of chances created and conceded.
Understanding Expected Points and xG
Underneath the hood it’s actually pretty simple.
Expected points quantify the number of points a team is expected to earn from a match, considering the probabilities of winning, drawing, or losing based on the quality of chances during the game.
The mathmatical calculation is straightforward:
Expected Points =(3×𝑃win)+(1×𝑃draw)+(0×𝑃loss)We can use this metric plenty of different ways:
Performance Analysis: Assess whether a team's actual points reflect their performance quality.
Strategic Insights: Identify areas where a team is overperforming or underperforming.
Predictive Modeling: Enhance forecasting for future matches.
To calculate expected points we need to use expected goal values and take the following steps:
Aggregate xG Values: Sum the xG of all shots for each team.
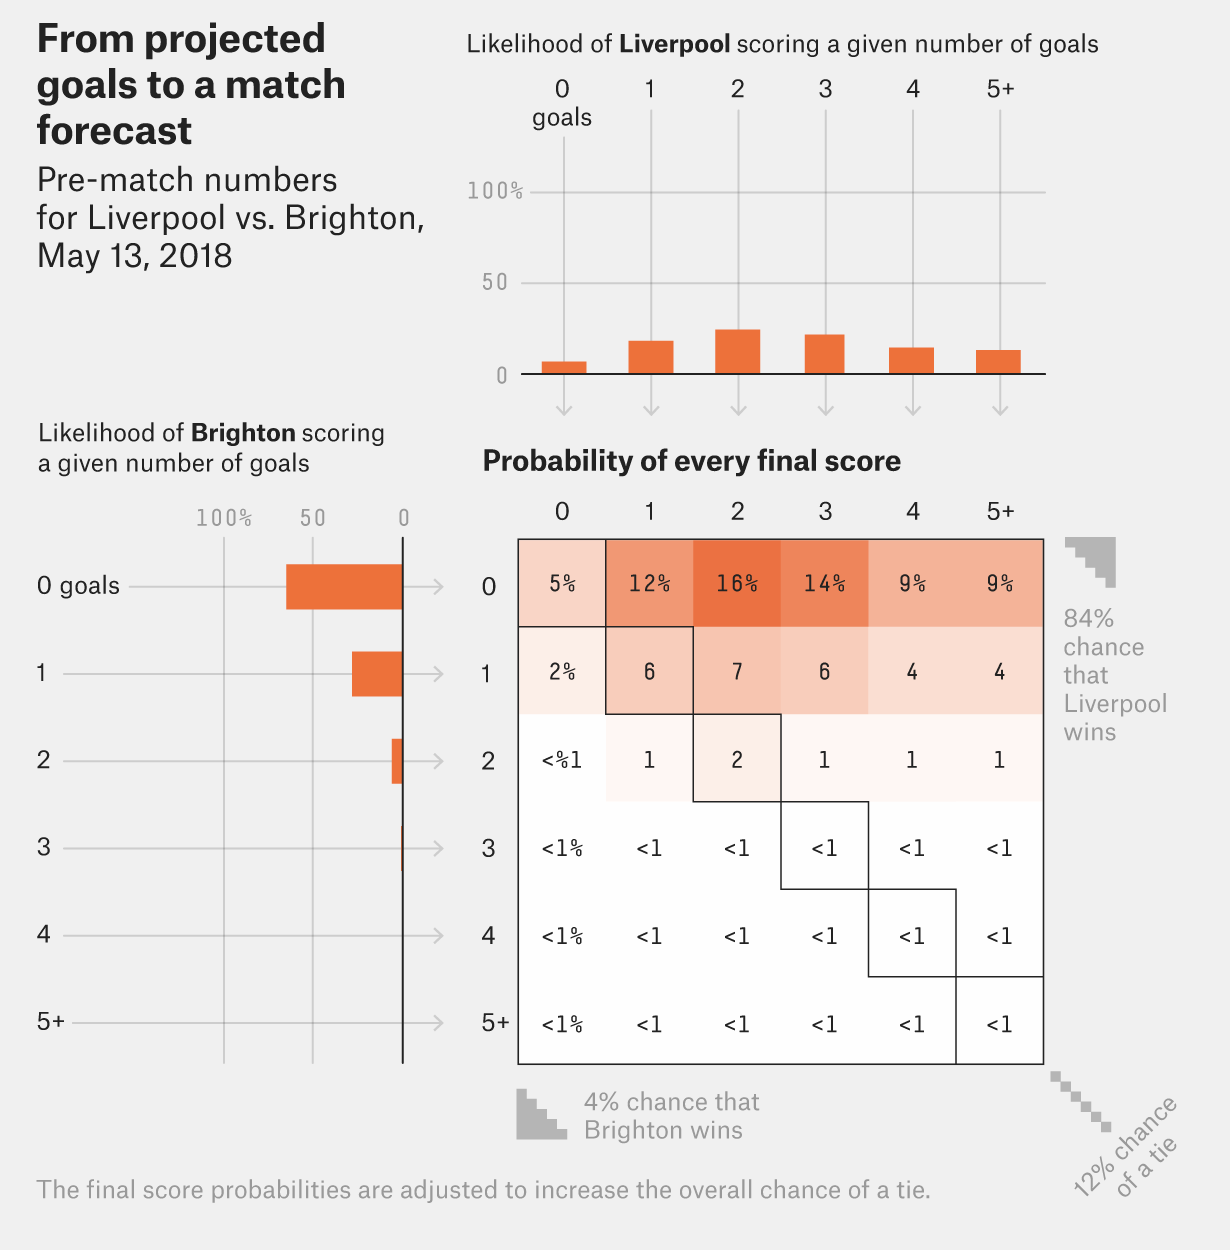
Model Goal Probabilities: Use the Poisson distribution to estimate the probability of scoring a certain number of goals.
Determine Match Outcome Probabilities: Calculate the probabilities of winning, drawing, or losing.
Compute Expected Points: Use these probabilities to calculate expected points.
Step-by-Step Implementation in Python
Step 1: Import Necessary Libraries
We'll use numpy for numerical operations and scipy.stats for statistical functions.
import numpy as np
from scipy.stats import poisson
Step 2: Aggregate xG Values for Each Team
Suppose we have xG data for both teams from a match.
# xG values for each shot taken by Team A and Team B
team_A_shots_xG = [0.1, 0.05, 0.2, 0.15]
team_B_shots_xG = [0.05, 0.1, 0.05]
team_A_xG = sum(team_A_shots_xG)
team_B_xG = sum(team_B_shots_xG)

print(f"Team A Total xG: {team_A_xG}")
print(f"Team B Total xG: {team_B_xG}")

Output:
Team A Total xG: 0.5
Team B Total xG: 0.2
Step 3: Model Goal Scoring Probabilities Using Poisson Distribution
The Poisson distribution models the probability of a given number of goals being scored based on an average rate (λ), which, in this case, is the team's total xG.
# Maximum number of goals to consider
max_goals = 5

# Calculate goal probabilities for Team A and Team B
team_A_goal_probs = [poisson.pmf(i, team_A_xG) for i in range(max_goals + 1)]
team_B_goal_probs = [poisson.pmf(i, team_B_xG) for i in range(max_goals + 1)]
Step 4: Determine Match Outcome Probabilities
Create a matrix representing the probabilities of all possible scorelines.
# Probability matrix for all possible scorelines
match_probs = np.outer(team_A_goal_probs, team_B_goal_probs)
Each cell (i, j) in match_probs represents the probability of Team A scoring i goals and Team B scoring j goals.
Calculate the probabilities of Team A winning, drawing, and losing:
# Probability of Team A winning (Team A scores more than Team B)
P_win = np.sum(np.tril(match_probs, -1))

# Probability of a draw (both teams score the same number of goals)
P_draw = np.sum(np.diag(match_probs))

# Probability of Team A losing (Team A scores fewer goals than Team B)
P_loss = np.sum(np.triu(match_probs, 1))

print(f"Probability of Win: {P_win:.4f}")
print(f"Probability of Draw: {P_draw:.4f}")
print(f"Probability of Loss: {P_loss:.4f}")
Output:
Probability of Win: 0.3371
Probability of Draw: 0.5475
Probability of Loss: 0.1153Step 5: Calculate Expected Points
Now, compute the expected points using the outcome probabilities.
expected_points = (3 * P_win) + (1 * P_draw)
print(f"Expected Points: {expected_points:.2f}")

Output:
Expected Points: 1.56
Step 6: Apply to Multiple Matches
Suppose we have xG data from several matches.
We’ll create a function to make the code repeatable and then loop over all of our matches (long piece of code this time so we’ll just do a screenshot)
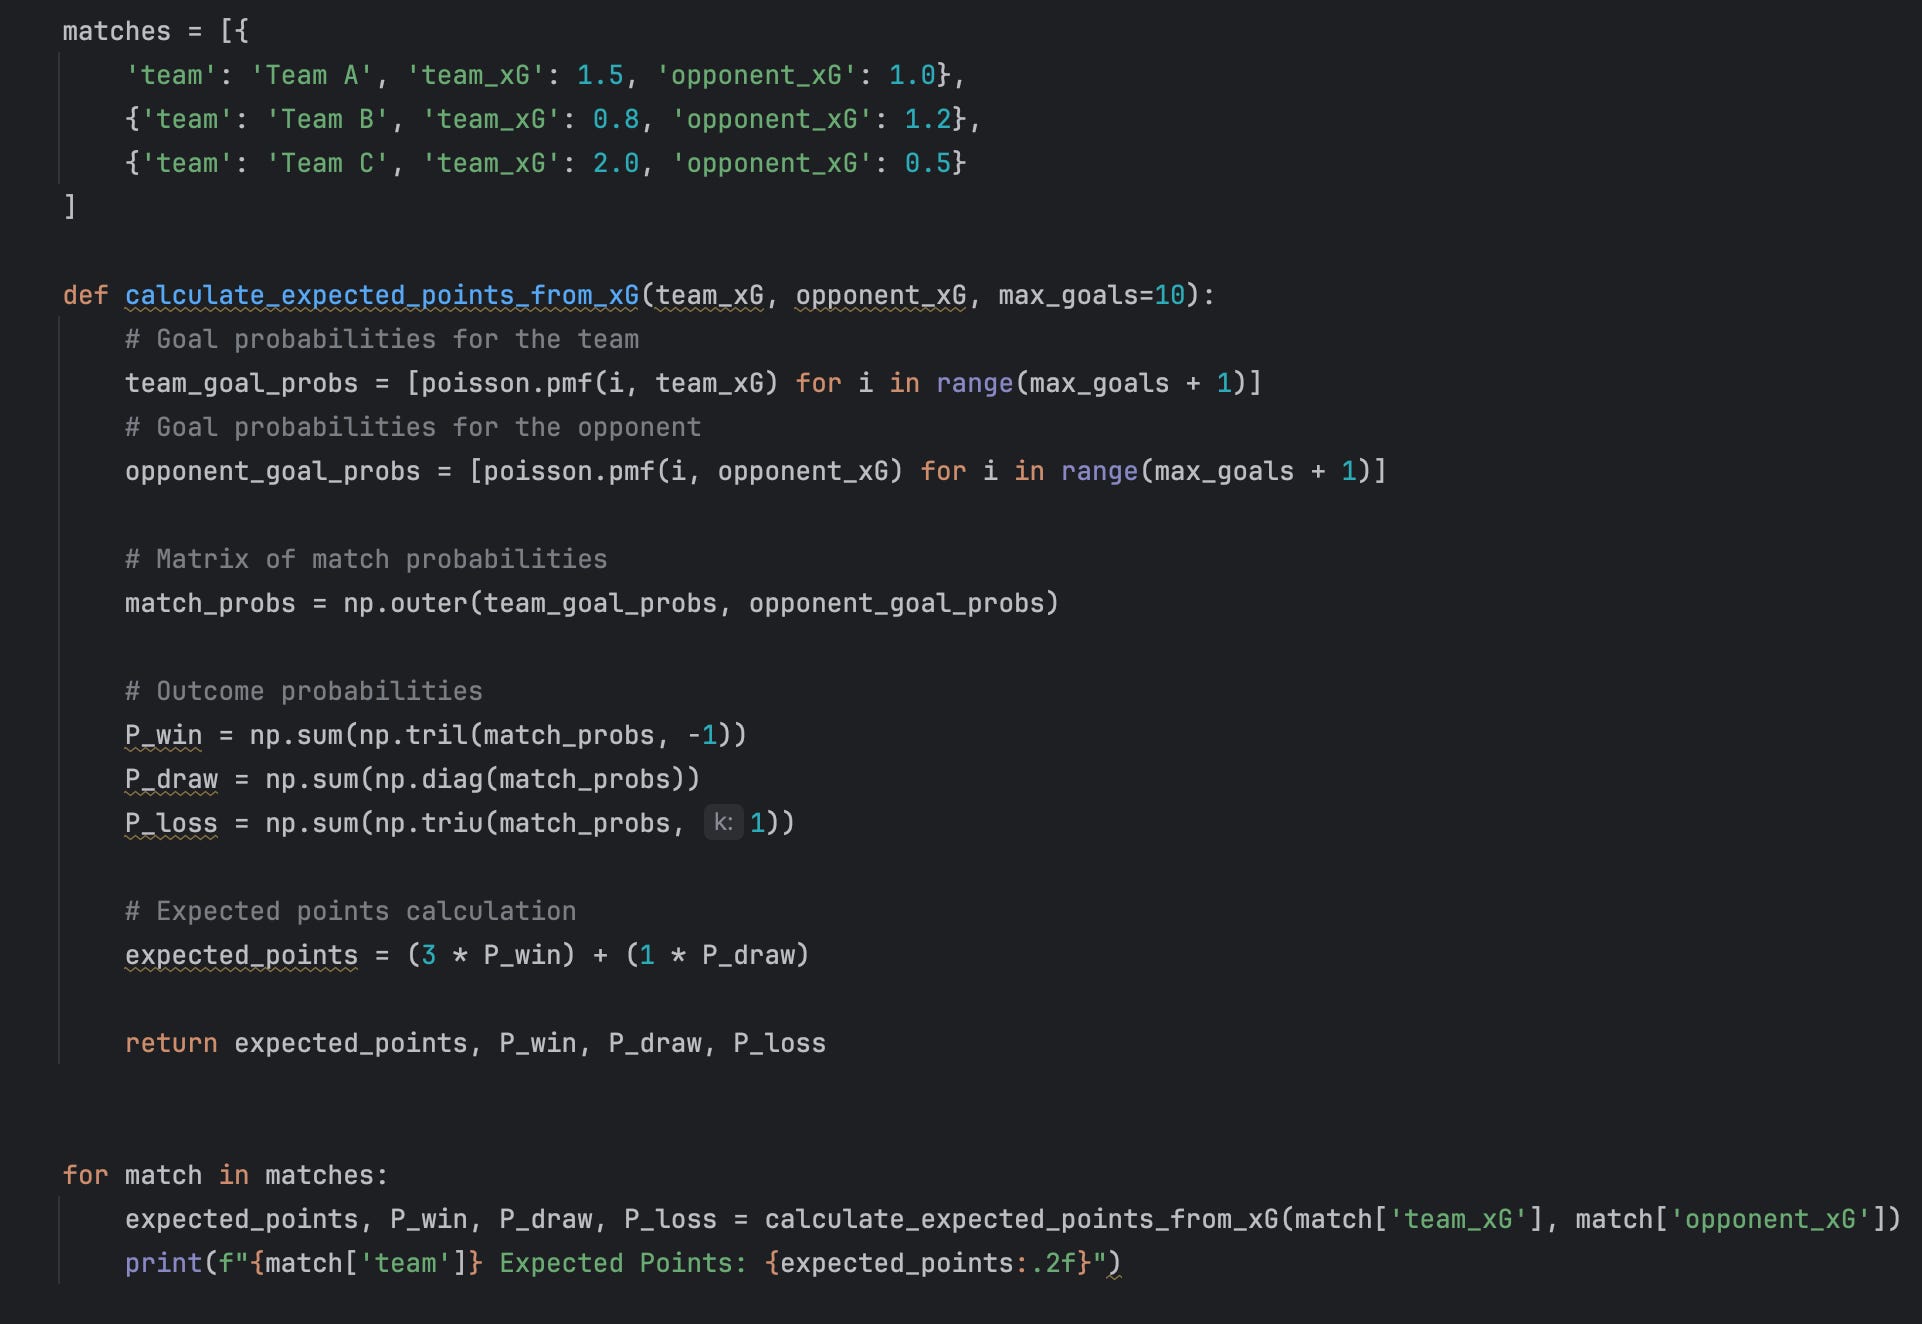
Team A Expected Points: 1.72
Team B Expected Points: 1.04
Team C Expected Points: 2.38
And that’s it! Very simple at it’s core but a really great tool for evaluating matches.
Here’s a couple of nuances to take into consideration:
Constant Goal Scoring Rate
The Poisson distribution assumes that goals are scored independently and at a constant average rate throughout the match.
This means:
Uniform Scoring Probability: The likelihood of scoring is the same in every minute of the game.
Independence of Events: Each goal-scoring opportunity is independent of others.
Implications of This Assumption
Simplifies Calculations: Makes the mathematical modeling straightforward.
Limitations:
Ignores Game Dynamics: Does not account for time-dependent factors like fatigue or tactical changes.
No Game State Influence: Assumes the current scoreline doesn't affect the team's scoring rate.
xPts is a very useful model for evaluating performances. By using xG data and the Poisson distribution it can provide valuable insights into team performance.
The Poisson model assumes a constant goal-scoring rate, acknowledging its limitations allows us to interpret results more effectively and consider refinements for future analyses.
PS.
This article took more effort than my normal newsletters and posts. I have been thinking about doing more of this type of content but making it as part of a paid version, would you be interested in that?
If so, I’d love to hear what type of content you would like to see or any benefits for subscribing to a paid version of this newsletter.
Feel free to respond to this email and let me know 😃
Love this! Super simple and intuitive, is there any way that this can be applied to NFL games?
This is well explained. You explained it in an intuitive way.